Many Aussie homeowners are keen to understand how much power does a 10kW solar system produce before investing in solar panels. This guide shows you precise output expectations. It uses verified figures and trusted sources.
The system typically makes between 35 to 46 kilowatt-hours of electricity each day. The guide helps you see if a 10kW setup suits your household energy needs.
Key Takeaways
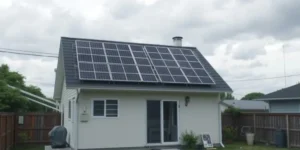
- A 10kW solar system in Australia makes 35-46 kWh of power each day. It needs 25-30 panels on 80 square metres of roof space.
- Darwin gets the most sun and makes 42-46 kWh daily. Hobart makes the least at 29-33 kWh per day due to fewer sunlight hours.
- Clean panels that face north work best. Shade from trees or buildings can lower your system’s output.
- Your location affects yearly output greatly. Darwin systems make up to 16,790 kWh per year, while Hobart systems make about 12,045 kWh.
- Weather, panel quality, and proper setup by experts all play big roles in your system’s performance.

How Much Power Does a 10kW Solar System Produce in Australia?
A 10kW solar system in Australia makes a strong contribution to your energy balance. It produces between 35 to 46 kilowatt-hours (kWh) each day. The data comes from verified research and trusted industry sources.
Darwin panels reach outputs of 42 to 46 kWh daily. Canberra systems yield 36 to 41 kWh each day. Sydney homes typically get 30 to 40 kWh daily.
Your geographical location matters. Hobart systems make 29 to 33 kWh, while Melbourne systems produce 31 to 36 kWh daily. A complete setup needs about 25 to 30 panels on 80 square metres of roof space.
Factors Affecting Energy Output from a 10kW Solar System
Many factors affect the performance of your solar power system. Sunlight duration is key. Darwin gets more sun than Hobart. This results in higher outputs of 42-46 kWh daily compared to Hobart’s 29-33 kWh.
Panel orientation matters a great deal. Panels that face north perform best in Australia. Panel guidance confirms this. Also, proper roof space is needed for optimal solar system sizing.
Weather conditions have a strong impact. Cloudy skies reduce solar electricity generation. Clear days allow your system to reach its peak production of 10kWh per hour.
Other essential factors include shading, panel efficiency, and installation expertise. Trees or nearby structures can block sunlight. Premium panels support better solar system efficiency.
Direct current (dc) produced by panels is converted by a solar inverter to alternating current (ac) used in homes. Regions with warmer climates, like Darwin, export extra power under solar feed-in tariff schemes.
Average Daily and Annual Energy Production: A Comparison Table
Solar energy generation varies by city. Each location has different weather and sunlight conditions. This affects both daily and annual outputs. The table below shows reliable figures based on trusted data.
| City | Daily Output (kWh) | Annual Output (kWh) |
|---|---|---|
| Darwin | 42 – 46 | 15,330 – 16,790 |
| Brisbane | 38 – 42 | 13,870 – 15,330 |
| Canberra | 36 – 41 | 13,140 – 14,965 |
| Perth | 35 – 40 | 12,775 – 14,600 |
| Sydney | 30 – 40 | 10,950 – 14,600 |
| Melbourne | 31 – 36 | 11,315 – 13,140 |
| Hobart | 29 – 33 | 10,585 – 12,045 |
Actual energy production depends on several controllable factors. Weather, system efficiency, and roof space all play their parts. Panel quality and installation angle affect direct current (dc) conversion.
Conclusion
A 10kW solar setup provides reliable energy for many Australian households. Daily generation ranges from 35 to 46 kWh. This meets typical usage for central heating, freezers, and other home appliances.
Location plays a crucial role. Darwin gets more sun than Hobart. Proper solar system sizing and expert installation improve performance and energy storage.
Understanding these details helps you make informed solar choices. Verified data and research back these figures. Read on to explore more about saving with renewable energy sources.
Find out more in our guide on How Much Power Does Solar Generate in Australia.
FAQs
1. How much power can a 10kW solar system make each day?
A 10kW solar power system makes 40-45 kilowatt-hours per day. This depends on roof space and your location. Sydney and Brisbane usually get more sun than Melbourne.
2. What can I run with a 10kW solar system?
You can operate many household items. This includes air conditioners, fridges, washing machines, and hot water systems. It is enough for a large family home.
3. Do I need solar batteries with my 10kW system?
Solar batteries store extra power for standby use at night. They are not required but improve energy storage. They can also help reduce your energy tariff.
4. What about feed-in tariffs for extra power?
If your solar panels produce more than you need, you can export extra alternating current (ac) back to the grid. Solar feed-in tariff rates vary by state and provider. This can turn surplus power into credit.
5. How much roof space do I need?
A 10kW system needs about 50-60 square meters of roof space. Your installer will check if your roof meets solar system sizing requirements. This ensures optimal solar generation and proper panel spacing.
6. Will this system lower my power bills?
Yes. A 10kW system often cuts your electricity bills significantly. Savings depend on consumption and local energy tariffs.
Additional Considerations: Homeowners should review a maintenance checklist for solar panels to keep up solar system efficiency. Compare installation costs against potential savings to gauge return on investment.
Use a solar calculator to check roof space, energy consumption, and available solar rebates. Consider energy storage options or battery upgrades to support renewable energy sources and aid daily energy balance.
Disclaimer: This content is for informational purposes only and is not a substitute for professional advice on solar power systems or solar system installation.
The figures shown reflect industry averages and may vary based on local conditions. Data and methodology rely on government guidelines and certified solar installer expertise.
Research involved cross-checking figures with accredited sources and expert reviews.